概要
- mysqltunerは、MySQLの統計情報を使ってパフォーマンスチューニングのアドバイスをしてくれる。
- 最近はCVE(セキュリティ情報)も教えてくれるみたい。
- 調べた背景は、64GBのRAMが載ったApacheやbatchプログラムが共存したEC2インスタンスに48GBも
innodb_buffer_poolを盲目的に割り当てたベンダーが居て、それってどうなのよ?と思った。ベンダーに丸投げって怖いな。- 案の定、「2周間後にメモリが100%になりそうになってOOM Killerが発動されてmysqlが落ちるよ」と3回ぐらい警告したら設定値を変更してくれた。
インストール
cd /tmp
wget https://github.com/major/MySQLTuner-perl/zipball/master
unzip master
cd major-MySQLTuner-perl-b828a6e/
./mysqltuner.pl
実行
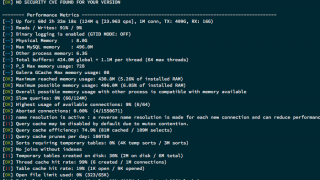
自分のサーバはどうなんだろうと思って実行してみたけど、まぁ、適当に設定している割には良い感じ。
[OK] Currently running supported MySQL version 5.7.18-log
[OK] Operating on 64-bit architecture

-------- Log file Recommendations ------------------------------------------------------------------
[--] Log file: /usr/local/var/mysql/teraren.local.err(0B)
[!!] Log file /usr/local/var/mysql/teraren.local.err doesn't exist
[!!] Log file /usr/local/var/mysql/teraren.local.err isn't readable.

-------- Storage Engine Statistics -----------------------------------------------------------------
[--] Status: +ARCHIVE +BLACKHOLE +CSV -FEDERATED +InnoDB +MEMORY +MRG_MYISAM +MyISAM +PERFORMANCE_SCHEMA
[--] Data in InnoDB tables: 15G (Tables: 490)
[--] Data in MyISAM tables: 60M (Tables: 161)
[!!] Total fragmented tables: 1

-------- Security Recommendations ------------------------------------------------------------------
[OK] There are no anonymous accounts for any database users
[OK] All database users have passwords assigned
[!!] User 'tel@%' hasn't specific host restriction.
[--] There are 612 basic passwords in the list.


-------- CVE Security Recommendations --------------------------------------------------------------
[OK] NO SECURITY CVE FOUND FOR YOUR VERSION

-------- Performance Metrics -----------------------------------------------------------------------
[--] Up for: 60d 2h 32m 18s (124M q [23.963 qps], 1M conn, TX: 409G, RX: 16G)
[--] Reads / Writes: 91% / 9%
[--] Binary logging is enabled (GTID MODE: OFF)
[--] Physical Memory     : 8.0G
[--] Max MySQL memory    : 496.0M
[--] Other process memory: 6.3G
[--] Total buffers: 424.0M global + 1.1M per thread (64 max threads)
[--] P_S Max memory usage: 72B
[--] Galera GCache Max memory usage: 0B
[OK] Maximum reached memory usage: 430.8M (5.26% of installed RAM)
[OK] Maximum possible memory usage: 496.0M (6.05% of installed RAM)
[OK] Overall possible memory usage with other process is compatible with memory available
[OK] Slow queries: 0% (66/124M)
[OK] Highest usage of available connections: 9% (6/64)
[OK] Aborted connections: 0.00%  (4/1550671)
[!!] name resolution is active : a reverse name resolution is made for each new connection and can reduce performance
[!!] Query cache may be disabled by default due to mutex contention.
[OK] Query cache efficiency: 74.9% (81M cached / 109M selects)
[!!] Query cache prunes per day: 100750
[OK] Sorts requiring temporary tables: 0% (4K temp sorts / 3M sorts)
[OK] No joins without indexes
[!!] Temporary tables created on disk: 30% (2M on disk / 6M total)
[OK] Thread cache hit rate: 99% (6 created / 1M connections)
[!!] Table cache hit rate: 19% (1K open / 9K opened)
[OK] Open file limit used: 0% (323/65K)
[OK] Table locks acquired immediately: 99% (985K immediate / 986K locks)
[OK] Binlog cache memory access: 99.93% (2455619 Memory / 2457387 Total)

-------- Performance schema ------------------------------------------------------------------------
[--] Memory used by P_S: 72B
[--] Sys schema is installed.

-------- ThreadPool Metrics ------------------------------------------------------------------------
[--] ThreadPool stat is disabled.

-------- MyISAM Metrics ----------------------------------------------------------------------------
[!!] Key buffer used: 19.9% (1M used / 8M cache)
[OK] Key buffer size / total MyISAM indexes: 8.0M/4.2M
[OK] Read Key buffer hit rate: 100.0% (8M cached / 134 reads)
[OK] Write Key buffer hit rate: 99.3% (462K cached / 458K writes)

-------- InnoDB Metrics ----------------------------------------------------------------------------
[--] InnoDB is enabled.
[--] InnoDB Thread Concurrency: 0
[OK] InnoDB File per table is activated
[!!] InnoDB buffer pool / data size: 256.0M/15.5G
[!!] Ratio InnoDB log file size / InnoDB Buffer pool size (37.5 %): 48.0M * 2/256.0M should be equal 25%
[OK] InnoDB buffer pool instances: 1
[--] Number of InnoDB Buffer Pool Chunk : 2 for 1 Buffer Pool Instance(s)
[OK] Innodb_buffer_pool_size aligned with Innodb_buffer_pool_chunk_size & Innodb_buffer_pool_instances
[OK] InnoDB Read buffer efficiency: 99.91% (53923725522 hits/ 53974926093 total)
[!!] InnoDB Write Log efficiency: 66.99% (7965306 hits/ 11890918 total)
[OK] InnoDB log waits: 0.00% (0 waits / 3925612 writes)

-------- AriaDB Metrics ----------------------------------------------------------------------------
[--] AriaDB is disabled.

-------- TokuDB Metrics ----------------------------------------------------------------------------
[--] TokuDB is disabled.


コメント